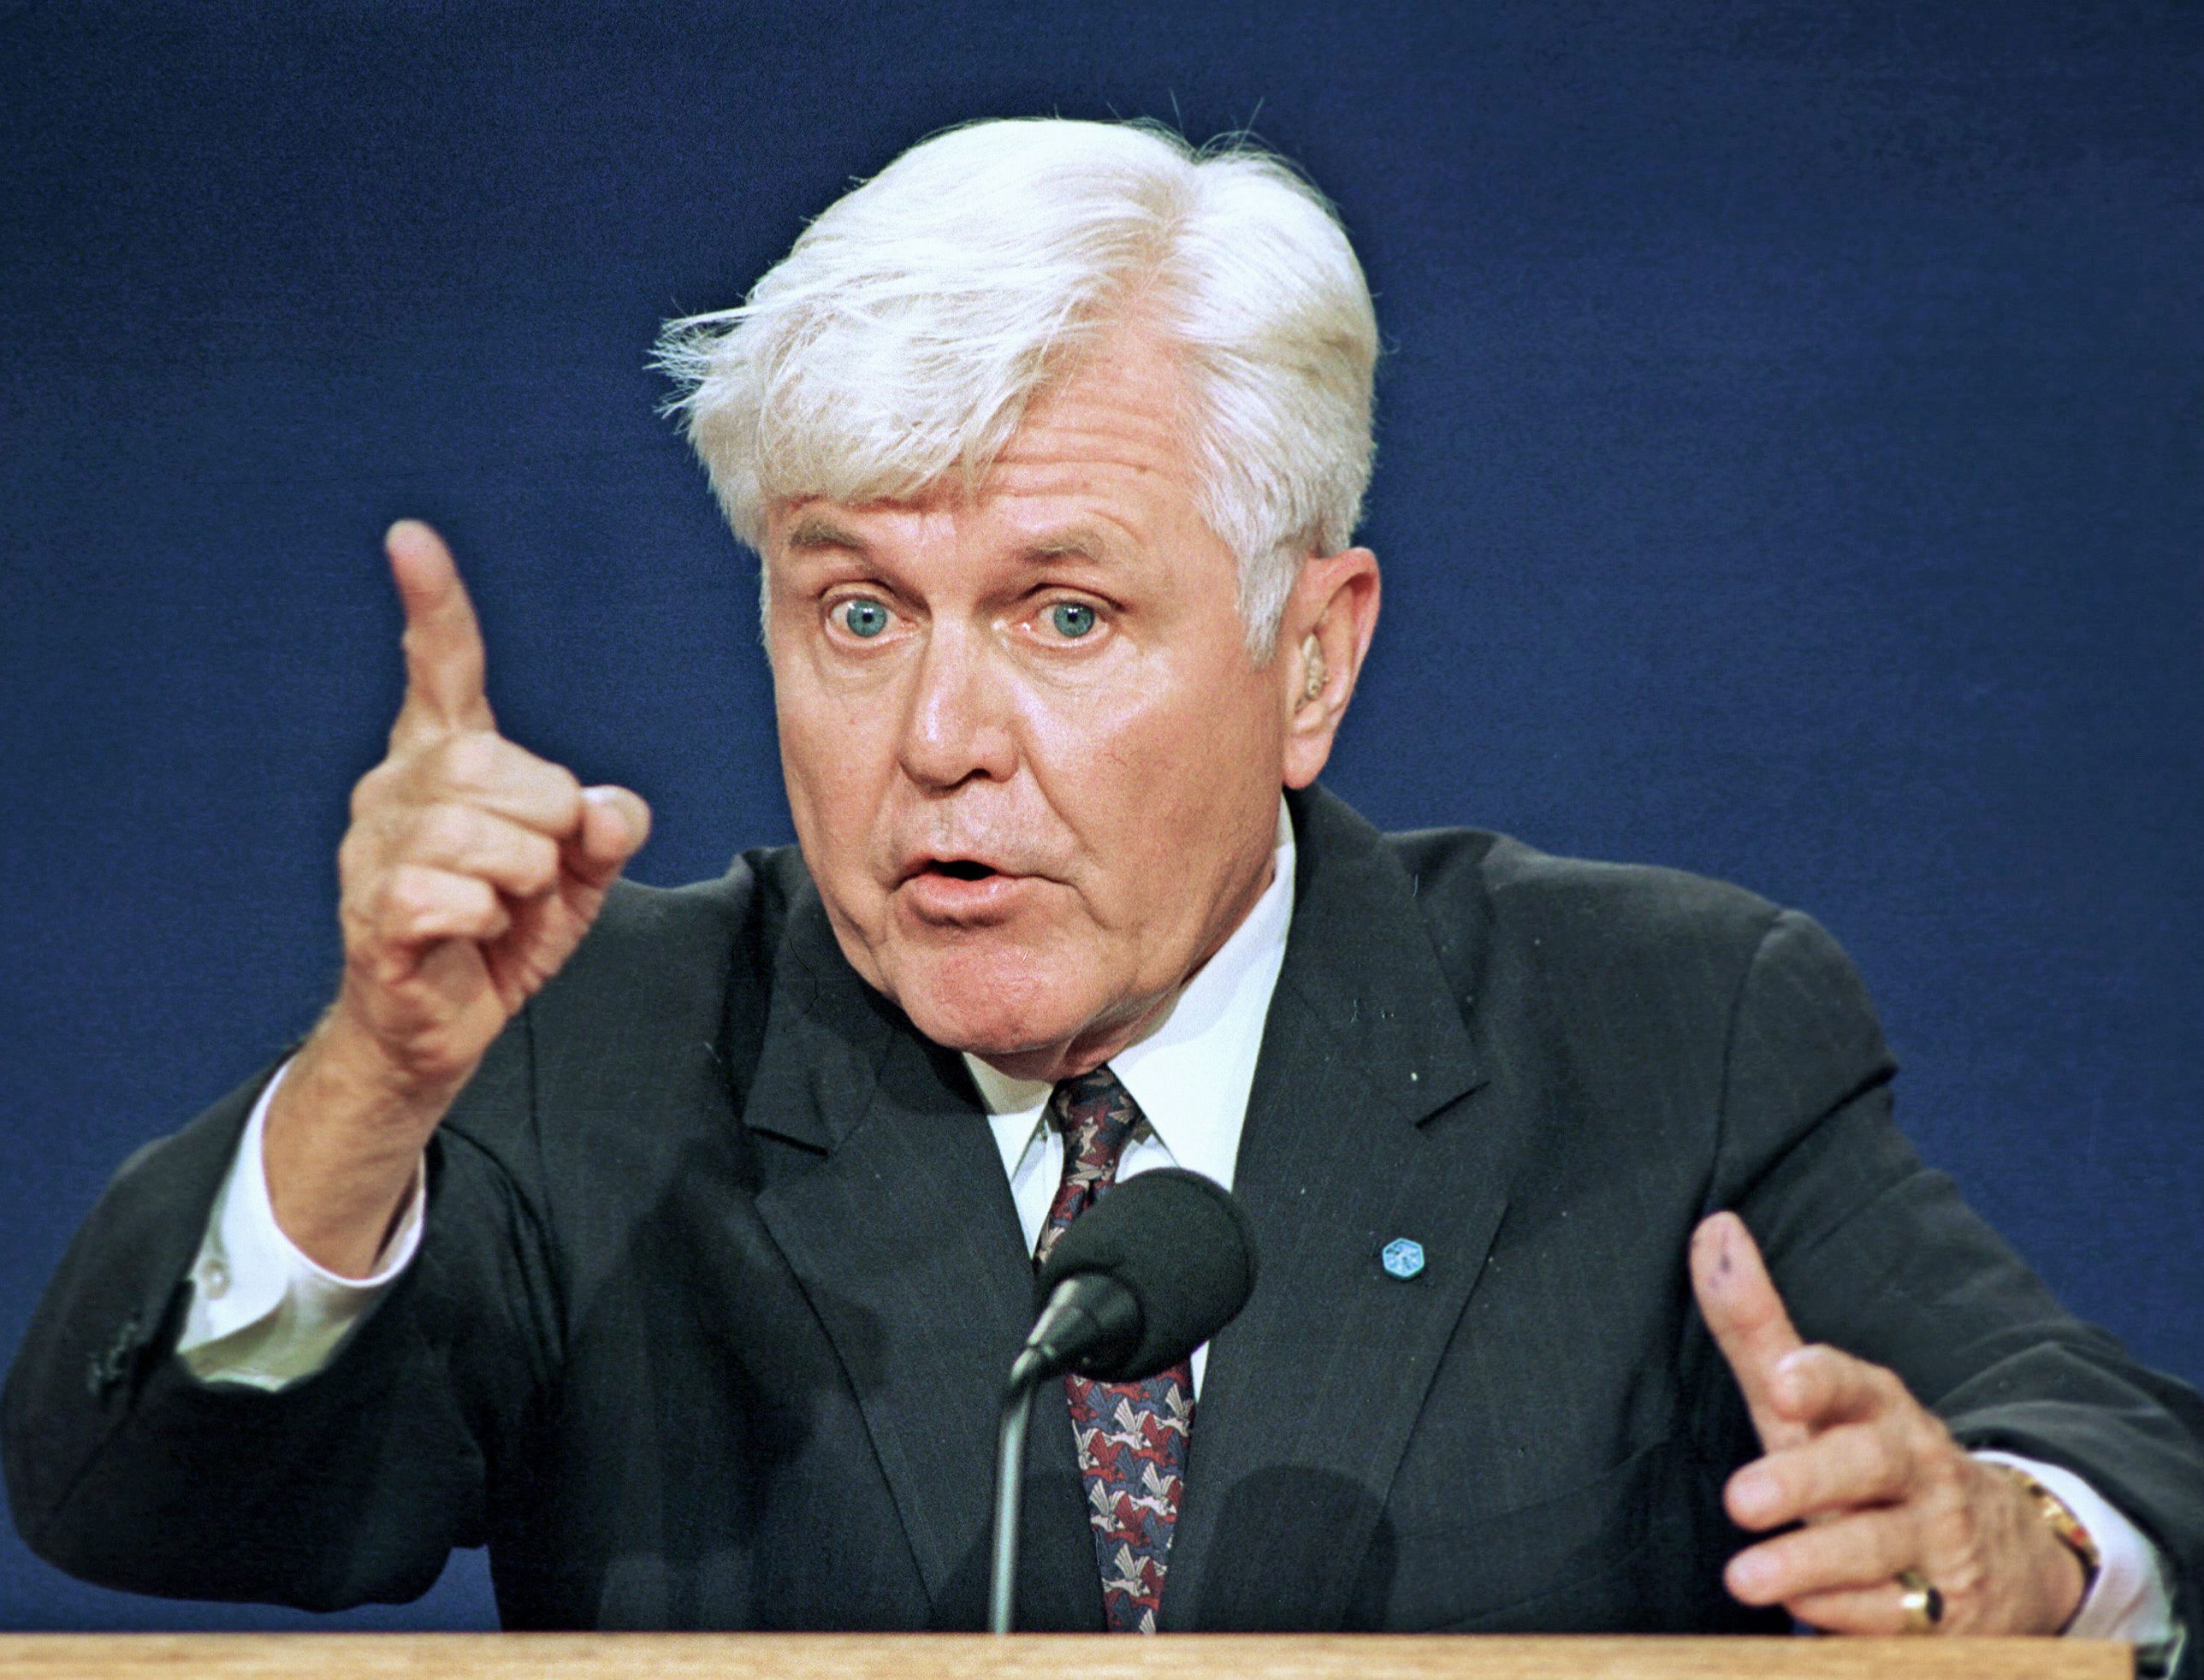
(2004) - John Edwards was riding high in 2004. He'd gone from a little-known 1-term Senator to runner-up in the 2004 Democratic Primary and was the party's nominee for Vice-President. But then came 2008. He entered the race as one of the top candidates on the Democratic side, but never caught fire. That year, he won fewer states, got fewer votes and fewer delegates and ended his campaign a month earlier than in 2004. Still, he reportedly made the short of list of VP nominees for Obama. Then he was rocked by scandal. Reports of an extramarital affair had started in late 2007 and by the summer of 2008 they had reached a head. This eliminated him from consideration for any roll in the Obama campaign or cabinet. He had cheated on his sick wife, fathered a child, and clumsily attempted to cover it up. Furthermore he was accused of using more than $1 million of campaign funds to cover up his affair. He was indicted on six felony charges and forced to pay $2.1 million back to the FEC. He was found not guilty on one charge, while the jury failed to reach a verdict on the others. The case was dropped and Edwards returned to life as a lawyer - though now a politically toxic one. Scandalized, sanctioned, reviled and indicted - it's had to see anyone taking the bottom spot from him without actually being convicted of a crime.
(1968) - The former Air Force general left the Republican party to support George Wallace and was subsequently named his running mate. After the election, his political career (he had earlier been approached by Republicans as a possible Senate candidate) was over and his public reputation was significantly diminished. Though he did not share Wallace's pro-segregation positions, running with him left LeMay forever attached to them and LeMay was often assumed to have shared his racist views, despite the evidence to the contrary.
(1856) The former ambassador was Fillmore's running mate on the American Party ticket. Afterwards he was involved in the Constitutional Union party and went to their nominating convention in 1860. But after the Civil Was he was distrusted by the south because of his opposition to secession and the north because of his support of the war. During the war, he was briefly arrested by the Confederates, though the charges were deemed frivolous and he was released.
(1860) An Oregonian who ran on the pro-slavery Southern Democrat ticket with John Breckinridge, Lane returned to the Senate where he espoused pro-secession positions. As these ideas were unpopular in Oregon, his political career was over and he retired from the Senate in 1861. He retired to his ranch in Oregon where some think he kept a slave until the late 1870's.
(1832) Pennsylvania's former Attorney General who turned down an offer to be James Monroe's Secretary of War was on the losing ticket of the Anti-Masonic party in 1832. Two years later he ran for the Senate and lost to James Buchanan, after which he retired from politics.
101.
(1972) Shriver served as the replacement VP candidate, after Thomas Eagleton resigned, on the 1972 Democratic ticket with George McGovern. By then, the high points of his political career (ambassador, Peace Corps Director, OEO Director) were behind him. He made a run for the presidency in 1976, but he finished far back in the pack, placing in the top 2 in only the Vermont primary. He then retired from politics. Though his post-nomination political career was a bust, his long service as President and then Chairman of the Board of the Special Olympics likely enhanced his reputation.
(1888) - Grover Cleveland ran for president three times, with three different running mates. His running mate during his second, and only losing, run was the retired Senator Allen G. Thurman. After the election, Thurman went back into retirement, and was notably not chosen to be Cleveland's running mate in 1892, which is why he ranks slightly below the rest in this category. He, Joe Lieberman and Tim Kaine are the only people to be the VP nominee of a ticket that won the popular but didn't get to be VP (Thomas A. Hendricks was on a popular winning/EC losing ticket but he won election to the office later).
(1992) - For each of these men, the campaign for Vice-President marked the end of their political career. They either retired, returned to retirement or returned to their previous professions, apparently by choice. [Stockton, interestingly, ran without a running mate, as the Federalist Party did not have a nominee for president in 1820] Miller perhaps stands out because after his run he was featured in one of the first "Do you know me?" commercials for American Express.
(1848) - Butler went in to retirement following his loss, but was offered the office of Governor of Nebraska in 1855, a job he turned down. He also attended the 1861 Peace Conference in Washington.
92.
(1860) - The Constitutional Union Party nominee for Vice-President in 1860, Everett's career high point came at the end of Millard Fillmore's presidency when he replaced the recently deceased Daniel Webster as Secretary of State. After 1860, Everett remained in a state of semi-retirement working to avoid the Civil War via the Crittenden Compromise and then supporting the Union War effort. Most famously, he gave the featured speech at Gettysburg, which was followed by a much shorter and famous speech by Abraham Lincoln.
91.
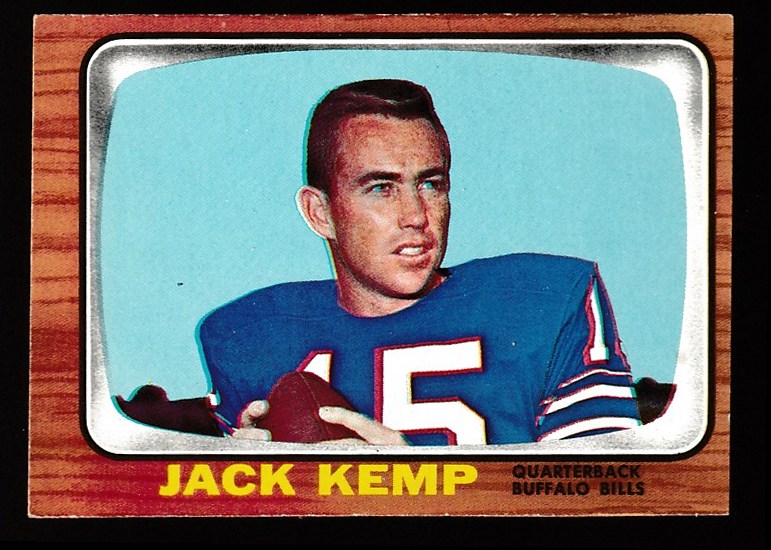
(1996) - After losing the 1996 election, the Republican nominee and former HUD Secretary served on numerous boards and commissions including the Council on Foreign Relations Task Force on Russia and also considered a run for president in 2000. He held various public roles dealing with Russia and poverty and was heavily involved in the McCain campaign before his untimely death.
(1844) - Henry Clay's 1844 running mate, the former Senator Frelinghuysen returned to his job as President of NYU after defeat and later became President of Rutgers.
(1960) - Nixon's first running mate, the former Senator and U.N. ambassador served the next three presidents as an ambassador to South Vietnam, West Germany, at-large and to the Holy See. He also came in 4th place in the 1964 Republican presidential primaries, winning three states as a write-in candidate, without entering the race or campaigning.
(1828) Richard Rush, had been Secretary of the Treasury under John Q. Adams and he became Adams' running mate because Adams' vice-president John C. Calhoun chose to run with Adams' opponent Andrew Jackson (in 1824, Calhoun had been the running mate for both candidates). After the election, he spent time as a low-level diplomat before serving as Polk's Minister to France.
(1856) The Republican Party's 1st Vice-Presidential nominee, Dayton had been a Senator but after his 1856 loss with Fremont, he was the Attorney General of New Jersey and then Lincoln's Minister to France.
(1852) Winfield Scott's running mate on the 1852 Whig ticket, Graham had been a Senator, Governor and Secretary of the Navy. After the 1852 election he returned to the State Senate in North Carolina and was later elected to the Confederate Senate at the end of the Confederacy. In 1866 he was re-elected to the United States Senate but, because North Caroline had not been readmitted, he was never seated. Remained active in national matters until his death.
(1860) Stephen Douglas' running mate for the northern wing of the Democratic Party, Johnson had been both a Governor of and Senator from Georgia. After the 1860 election, he became a Senator in the Confederacy, despite opposing secession and then a US Senator, though, like Graham he was never seated. He then served as a circuit court judge until his death.
84. Thomas Pinckney (1796) Pinckney is the only person who didn't win office even though his running mate did. Though every elector got two votes, and ostensibly electors would be expected to vote for both of their party's candidates, that did not happen in 1796. South Carolina electors, for example, voted for Jefferson (from the Democratic-Republican Party) and Pinckney (from the Federalists). In addition, neither party was united in their choices for the VP so votes were split among 13 people (including Washington who was not running). It was a crazy time. Anyway after he lost Pinckney, who'd previously been Governor of South Carolina, served for 4 years in the House and then retired to his plantation where he re-emerged from private life to serve in the War of 1812 and to blame a potential slave revolt on things like "teaching black people to read" and "letting black people have money" so maybe it's best that he didn't win. Notably he and his brother Charles are the only pair of siblings to be nominated for VP.
83. Nathaniel Macon (1824) Macon was a replacement candidate for Vice-President when William Campbell withdrew. He had been Speaker of the House 15 years earlier, but had later moved to the Senate where he would remain after his failed run for the VP seat. He was later President pro tempore of the Senate.
82. Schuyler Colfax (1868) Colfax was Speaker of the House when he was elected to serve as Grant's VP, with an eye on the White House. He served as VP for the length of Grant's first term. Expecting Grant to defer from running he positioned himself to gain the Republican Party nomination for President in 1872. Instead, Grant did run and he dropped Colfax from the ticket. During the end of his term he was caught up in a bribery scandal and articles of impeachment were drafted for him. The impeachment vote failed in the House, on party lines, in part because his term was nearly over. He returned to Indiana, went into business and never sought office again.
81. John Nance Garner (1932, 1936) Like Colfax, Garner was serving as Speaker of the House when he sought the Democratic nomination for President. He didn't win, but he parlayed his support into the second spot on the ticket. They won and then won again in 1936, but Garner found the job boring saying it was "not worth a bucket of warm piss." With FDR being cagey on running again, Garner ran for President again in 1940. FDR engineered a "spontaneous" re-nomination and Garner was off the ticket. He returned to Uvalde, TX for a long retirement.
Nomination was during career high point
80.
Fielding L. Wright (1948) Strom Thurmond's States Rights Party running mate in 1948, Fielding Wright returned to his office as Governor of Mississippi until he was term-limited out of office. He returned to the practice of law in 1952 and made another run for Governor, but finished third in the 1955 Democratic primary, thus missing the runoff. He died the next spring.
79.
Charles W. Bryan (1924) The brother of William Jennings Bryan (making them the only brothers to be nominated for President and Vice-President), Bryan was the running mate of John W. Davis on the 1924 Democratic ticket. In order to run for VP, Bryan did not run for re-election as Governor of Nebraska. He did run, unsuccessfully, in 1826 and 1828 and then won and retained the office in 1830 and 1832. He then served as Mayor of Lincoln, a job he'd held previously in 1915-17 and made one last, unsuccessful, run for Governor in 1838.
78. J
ohn W. Bricker (1944) Dewey's first running mate, Bricker was unable to run for Governor at the same time, but two years later he was elected to the Senate where he served for 12 years before losing the seat to Stephen Young in 1958.
77. Joe Lieberman (2000) After missing the vice-presidency by only a few hundred votes in Florida, Lieberman remained in the Senate. He sought the Democratic Party nomination in 2004, but after starting out well in the polls, failed to win any delegates, mustering only a single 2nd place finish. In 2006, he lost the Democratic primary to retain his Senate seat, but was able to run as an independent and keep it. He was reportedly John McCain's first choice for Vice-President on the 2008 Republican ticket, but was passed over for Alaska Governor Sarah Palin. He chose not to run for his senate seat in 2012 and retired from politics. He spent his time working as a lawyer and lobbyist and serving on the boards of various causes. In 2017 he was reportedly considered as a replacement for James Comey as FBI director but then passed over. He also introduced Betsy DeVos at her Secretary of Education confirmation hearings.
76. Burton K. Wheeler (1924) Democrat Wheeler was the running mate of Republican Robert La Follette, Sr. on the Progressive Party ticket. He returned to the senate where he served another 24 years before losing the 1946 primary to Leif Erikson (the less famous one).
75. Jared Ingersoll (1812) - Ingersoll was DeWitt Clinton's running mate on the 1812 Democratic-Republican ticket (though in many ways it was really the Federalist ticket. It's complicated). He spent a decade as Pennsylvania's Attorney General before the nomination and another four years in that job afterward. He spent the last year of his life as the presiding judge on Philadelphia's district court.
74. Whitelaw Reid (1892) Benjamin Harrison's 2nd VP nominee Reid had been his ambassador to France. 13 years later he became Teddy Roosevelt's ambassador to the UK and continued in that role under Taft until his death in 1912.
73. Henry Lee (1832) Lee, an economist who never held office, was John Floyd's running mate on the Independent Democrat ticket in 1832. They won only 1 state, Floyd's home state of South Carolina. Following the election, Lee returned to his prior career as a writer and merchant.
72. Arthur Sewell (1896) One of William Jennings Bryan's running mates in Bryan's first run, Sewell was a wealthy shipbuilder who went back to shipbuilding and being wealthy after his loss and then died a few years later. Often considered one of the worst nominees in history.
71. John A. Logan (1884) - After losing the 1884 election with his running mate James G. Blaine by a little more than 1000 votes, Logan returned to the Senate where he served 2 more years before dying in his home in Columbia Heights in Washington, DC. Nearby Logan Circle is named for him.
70. Charles L. McNary (1940) - At the time of his nomination he was Senate Minority Leader, a job he held until his death almost four year later in February 1944. Like Logan, had he been elected he would not have lived to serve out his term. His running mate Wendell Wilkie also would have died in office (Oct 1944), meaning that if they had beaten Roosevelt and Wallace, Sam Rayburn would have become President of the United States, though only for 3 months.
69. George Washington Julian (1852, 1878) The Free Soil Party's vice-presidential candidate in 1852, Julian was a political newcomer at the time. He'd spent just four years in the Indiana state legislature as a Whig and a single term as a US Representative. He earned no electoral college votes in 1852, but makes this list because of 1878. After his loss in 1852, he joined the Republican Party and in 1860 he was returned to the House of Representatives where he served for 10 years before losing re-nomination. In 1872, now with the Liberal Republican party, he received 5 electoral votes for Vice-President when the party's presidential nominee Horace Greeley died between the election and the electoral college vote. He finished his public career, now as a Democrat, by serving for four years as the surveyor general of New Mexico.
68. Nathan Sanford (1824) Sanford, the former NY Senator and then Chancellor of New York was re-elected to the Senate 2 years after his loss in 1824. He served six more years in the Senate before retiring from politics.
67.
Estes Kefauver (1956) After having the 1952 Presidential nomination taken from him and finishing 2nd in 1956, Kefauver beat out John F. Kennedy for the vice-presidential nomination, but the ticket lost to Eisenhower/Nixon. Though early polling showed him the favorite for the 1960 Democratic nomination for President, Kefauver chose not to run for a 3rd time. He spent the last 7 years of his life in the Senate.
66. Tim Kaine (2016) Following the shocking loss of the Clinton/Kaine ticket, Kaine returned to the Senate. By 2024 he had served eight more years in the Senate.
65.
John Sparkman (1952) Adlai Stevenson's running mate in 1952, he was not chosen for the 1956 ballot, in part because he signed the "Southern Manifesto" and Tennessee's Senators Estes Kefauver and Albert Gore, Sr. had not. Sparkman nonetheless served another 26 years in the Senate, chairing 3 committees, before retiring in 1979 as the longest serving senator in Alabama history.
64.
John Sergeant (1832) Henry Clay's Republican running mate in 1832, Sergeant had twice been voted out of Congress and was out of office when nominated. He returned to the practice of law, but 4 years later was returned to Congress for a 3rd time. He was president of the Pennsylvania constitutional convention in 1838 and then resigned from Congress in 1841. He turned down cabinet and diplomatic positions and was nearly nominated to be Clay's running mate again in 1844.
Career Peaked after Nomination
63. Sarah Palin (2008) Palin's post nomination career has been an up and down affair to say the least. Not long after losing, she resigned as the Governor of Alaska and became a media personality with numerous public speaking, on-air pundit and reality TV show opportunities which paid her quite well. Though she has had much success endorsing candidates, most notably of 2010 tea party candidates and Donald Trump, and teased a White House run in 2012, her star power began to diminish as Trump's increased. After endorsing Trump in 2016, she lost a high-profile defamation case, got divorced, lost two races for Alaska's House seat and stopped generating as much media attention.
62.
Francis Granger (1836) Granger was in the house when he was named the nominee of the northern part of the Whig Party in 1836. He had to give up his house seat to run in that election. He came in 2nd in the Electoral College, but since Virginia's electors refused to vote for Richard Johnson, the race had to be decided in the country's only contingent election for Vice-President, which he lost. Later, he was reelected to the House two more times before serving for 6 months as
Postmaster General (a job his father held for a longer time than anyone else in U.S. history). He was then elected to congress again in a special election before leaving elected office to become a party leader.
61.
Rufus King (1804 and 1808) The only two-time loser of the Vice-Presidency who never won on this list, King went on from being the bottom half of the losing Federalist ticket with Charles Pinckney to being the top half in 1816 (and 1812, though he was never officially the party's nominee, which had none that year). In doing so he became the only person to run on four major party tickets without winning once. He later returned to the Senate and was again made Minister to Great
Britain - jobs he'd held prior to 1804.
60. Charles Coatsworth Pinckney (1800) The first of five people to lose the election for Vice-President and then go on to win their party's nomination for President, Pinckney was the Federalist party's nominee in 1804 and 1808 (losing both times).
59. Charles Francis Adams (1848) The son and grandson of presidents, Charles Francis Adams was practically royalty when he ran for vice-president on the Free Soil ticket in 1848, but his political experience was limited to the Massachusetts state legislature. 10 years after his failed run for VP, Adams was elected to the US House from his father's district. After being re-elected, he resigned to serve as Minister to the United Kingdom for 7 years and was later the U.S. arbiter of the "Alabama claims."
58. Joseph Taylor Robinson (1928) At the time of his nomination, Robinson was Senate Minority leader, but in 1933, following his loss, he was elevated to Majority Leader when the Democrats took control of the Senate. Together with FDR he led in the creation of much of the New Deal, until he was found dead in 1937 in his apartment across the street from the Senate.
57. Thomas E. Watson (1896) Watson, a House member, was William Jennings Bryan's running mate on the Populist ticket in 1896 (Sewall was his nominee on the Democratic ticket). Watson became the Populist party candidate for president in 1904, and then in 1920, after rejoining the Democratic Party, was elected to the Senate where he served until his death 2 years later.
56. Francis P. Blair, Jr. (1868) Blair was a former Republican congressman and Union General when he was chosen as the Democratic nominee for Vice-President. Blair is the odd vice-presidential candidate believed to have cost his party the election, in his case because of the stark racist nature of his campaign speeches. Nonetheless, two years after that loss, he was elected to the United States Senate to fill a seat made empty via resignation. Less than 2 years later he was paralyzed by a stroke and as a result lost election to a full term in 1873. As an act of charity, he was appointed state superintendent of insurance to provide him with an income, and then died in 1875.
55. Hiram Johnson (1912) Teddy Roosevelt's running mate on the Progressive Party ticket, Johnson remained the Governor of California until the end of his term. He was re-elected in 1914 and then ran successfully for the Senate in 1916 where he would remain until his death in 1945. He switched to the Republican Party and in 1920 sought the party's nomination for President, finishing third at the Convention (and 6th for Vice-President). He finished 3rd again in 1924. In the Senate he was an influential leader who crossed party lines to help FDR pass much of the New Deal.
54.
Edmund Muskie (1968) Senator Muskie emerged from the losing 1968 campaign in which he was the Democrats Vice-Presidential nominee as a popular politician and the leading candidate for the party's nomination. He won both the Iowa and New Hampshire primaries (in the newly formed primary system) but as a result of a letter, later discovered to be a forgery created by the Nixon campaign, in which Muskie was accused of making disparaging remarks about French-Canadians he gave a press conference, in which it appeared to some in the press that Muskie had shed a tear (he claimed it was melting snow since it was held outside in a snow storm), his presidential campaign collapsed. In 1980 he became
Secretary of State, and filled that role until the end of President Carter's term in 1981.
53.
Lloyd Bentson (1988) The Texas Senator lost the Vice-Presidency in 1988, but - due to Texas law - was able to run for, and keep, his Senate seat. Four years later he was tapped by Bill Clinton as the Secretary of the Treasury where he served for nearly two years before retiring.
52.
George J. Pendleton (1864) Rep. Pendleton had a bad year in 1864. He was on the bottom half of the losing presidential ticket and he lost his house seat too. He then proceeded to lose a race for his old house seat in 1866, his party's presidential nomination in 1868 (after leading for the first 15 ballots), and governor of Ohio in 1869. In 1878, after 14 years out of office, he was elected to the United States Senate, where he led passage of the Pendleton Act that ended the spoils system. This law was unpopular among members of his party and cost him re-election but he was appointed Envoy to Germany when his term was completed, a job he served in until shortly before his death.
51.
John W. Kern (1908) At the time of his nomination for VP in 1908, he was a lawyer who'd previously spent several years as Indianapolis' City Solicitor and made two failed runs for Governor. He was elected to the Senate 2 years leader and became the equivalent of the Senate Majority Leader (though that term was not in use at the time). He served only 1 term and retired due to poor health. He died 5 months after leaving office.
50. Frank Knox (1936) One of Teddy Roosevelt's former Rough Riders, Knox had never held office when he became Alf Landon's running mate in 1936. As an internationalist and a supporter of a strong military, Franklin Roosevelt tapped him to be Secretary of the Navy in 1940 as he tried to build a bi-partisan coalition in preparation for war. Knox served through most of the war - until his death in April 1944.
49. William Wilkins (1832) Wilkins is an odd one here, because he was only the nominee for VP in the state of Pennsylvania in 1832 (It is unclear if this was even something he sought or wanted) because Van Buren was unpopular there. He got the commonwealth's 30 electors and came in 3rd making him the recipient of the most Faithless Electors in US History (not counting 1872 when the VP nominee died). Afterwards he finished his term in the Senate, served as Minister to Russia, ran for the House and lost and then ran again and won, and was appointed Secretary of War by John Tyler, served in the Pennsylvania state legislature and was a Major General during the Civil War. In between he practiced law.
48. William R. King (1852) King, a long-term veteran of the Senate, was nominated for VP in 1852 and won, but had contracted tuberculosis by the time he took office and died 6 weeks later.
47. Aaron Burr (1796, 1800) Technically, Burr - then a Senator - was a candidate for President in 1796 as there were no tickets or running mates, but it was the intention of the Democratic-Republican party that all but one elector would cast their votes for Jefferson and Burr. The other elector would vote for Jefferson and someone other than Burr, thus making Jefferson president and Burr vice-president. Both parties meant to use this strategy but it failed, resulting in the President and Vice-President being from opposite parties and it failed again in 1800 resulting in a tie between Jefferson and Burr. Nonetheless, after Burr lost in 1796 he continued his political career serving 2 years in the New York state assembly and being given a high-profile military commission during the Quasi-War with France. In 1800 he was elected Vice-President, becoming one of only three people to win the Vice-Presidency on the 2nd try. And probably the only person to ever go from the state legislature to Vice-President. He was nearly elected president since he and Jefferson tied in the electoral college, forcing a Contingency Election, one of only two ever for the Presidency. This was "Peak Burr" followed by a rapid and tragic collapse. He quickly fell out of favor with President Jefferson and was dropped as Jefferson's VP in 1804, ran unsuccessfully for Governor of NY, killed Alexander Hamilton in a duel (for which he was indicted, but never tried), was charged with treason (but not convicted), went into exile to avoid his creditors, was kicked out of the UK, fought off poverty, had a brief marriage that was ended due to his poor land speculation and died alone in a boarding house on the same day his divorce was finalized. His wife in that divorce hired Alexander Hamilton, Jr. as her lawyer. Now that is cold.
46. Richard Johnson (1836) - In some ways, Johnson's career was already in decline when he was nominated as Van Buren's running mate. He had served in the Senate and was in the House of Representatives at the time. He and his running mate, Martin Van Buren won and Johnson became an unremarkable VP, who was disliked and distrusted and who took a 9 month long sabbatical to run a tavern on his farm. Though Van Buren was renominated in 1840, Johnson was not - with the party choosing to nominate no one instead. He campaigned for it anyway and, like Van Buren, came in 2nd. He then proceeded to lose races for the Senate, Governor of Kentucky and for the Presidency. He finally won a seat to the Kentucky state house in 1850, where he served two dementia-filled weeks before dying.
45. John C. Breckinridge (1856) Breckinridge, a veteran of the Mexican-American War and the House, was the winning nominee for VP in 1856. He was the Southern Democratic party nominee for President in 1860 and came in 2nd and then transitioned immediately into the Senate. Less than a year later, he joined the Confederate Army, was declared a traitor by the Senate, indicted for treason and expelled from the Senate. He rose to the rank of Major General in the Confederate Army and partook in numerous battles, before being named Confederate Secretary of State during the end of the war. He pushed for, and largely oversaw, the surrender of the Confederacy and then went into exile for years. After being pardoned he returned to the US and worked as a lawyer, refusing all overtures (including one by Grant) to return to politics or government service.
44 Paul Ryan (2012) Mitt Romney's running mate and the first house member nominated since Ferraro, Ryan didn't have to risk his house seat to run. Three years after failing to become President of the Senate, he became Speaker of the House - the only failed VP to do so. But he only lasted 3 years. He resigned and since has served on the board of Fox Corporation, as a guest lecturer at Notre Dame and as a head of delegation to Taipei for Donald Trump.
43 Thomas A. Hendricks (1876, 1884) Hendricks was the Democratic Party's losing nominee in the controversial election of 1876. He left office as Governor of Indiana the following January and went into a state of semi-retirement. In 1880, the Democrats wanted to nominate him for vice-president again, but he declined for health reasons (he suffered a stroke and lost the use of one foot as a result. By 1882 he could no longer stand). In 1884, as a salute to the ticket of 1876 and to unify the party, he was again the party's nominee for vice-president, and this time he won. He is the last person to win the vice-presidency on the 2nd try. Unfortunately, he died in office only 8 months later and his death is often one reason attributed to Cleveland's loss in the 1888 contest. In that race, Cleveland won more votes than his opponent, but lost the electoral college in part because he couldn't carry Hendrick's home state of Indiana. Cleveland lost Indiana by only ~2,400 votes.
42 Bob Dole (1976) The losing half of the Ford-Dole ticket, Dole would go on to serve in the Senate for nearly 20 more years - and seek the Presidency in every open election for the rest of that time. He more success in the former than he did the latter. He became Senate Minority Leader in 1987 and Majority Leader in 1995. After finishing last (11th) among all declared candidates in the 1980 Republican Presidential Primary, he was the runner-up in 1988 and finally the party nominee in 1996. He resigned his seat in the Senate to run and though he was the last nominee to have served in World War II, he lost the race and went into retirement. He is the last failed VP to later be nominated for President.
41. Elbridge Gerry (1812) Madison's running mate in 1812, replacing George Clinton who died in office, Gerry also died in office - about 20 months after being elected. Lesson: don't be Madison's running mate. Gerry, a signer of the Declaration of Independence, is mostly remembered for the use of his name in the word "gerrymander."
40. Henry Wilson (1872) Wilson, who had spent 18 years in the Senate, was Grant's 2nd Vice President. He died 2 and half years into his term. A school in DC was named for him, to recognize his role in providing federal funding for the education of black students, but otherwise he is mostly forgotten.
39. Garret Hobart (1896) Hobart was chosen as the VP candidate for McKinley after he ran the campaign of John Griggs who became the first Republican Governor of NJ in 30+ years. Hobart's experience was in NJ state legislature and he had been out of that for years. Hobart was from a swing state and as an easterner helped to balance the ticket. He was so trusted by McKinley and so successful at getting legislation through that people called him "Assistant President". He tragically died 2.75 years into his term from a heart ailment.
38. Spiro Agnew (1968, 1972) Agnew was the governor of Maryland with a reputation as a liberal Republican when he was selected to be Nixon's running mate. He served for almost 5 years before he resigned as part of a plea bargain deal involving bribery and tax evasion claims. He denied the claims but, in addition to taking the plea, he was later successfully sued and forced to repay the bribery money to the state of MD. He left office, lost his law license and went into business. He wavered between wealthy, and forced to go to friends and allies for loans. He leaned heavily into his antiemetic and anti-Israel beliefs and harbored grudges until very near the end of his life.
37. Kamala Harris (2020, 2024) Harris is the only woman and only person of Black or Asian heritage ever elected Vice-President. She'd spent years as a prosecutor and Attorney General and was a freshman Senator when Biden, in the midst of the Black Lives Matter movement, selected her to be his running mate following her failure to secure the party's presidential nomination that year. She has served 3.5 year in office at the time of the 2024 Democratic convention and is (in a bit of a surprise) the party's nominee for President in the 2024 race. During her time in office she broke the record for most tie-breaking votes cast by a VP making her the most successful VP ever (What metric do you want to use?)
36. James S. Sherman (1908, 1912) Sherman, a former mayor and House member, was elected with Taft in 1908. In 1912 he was again the Republican VP nominee with Taft. This marked the first time that the Republicans had ever renominated the same ticket in consecutive elections (and the first time any major party had since Van Buren and Richard Johnson in 1836 & 1840), but, he died days before the election was "replaced" by Nicholas M. Butler and then the ticket lost (came in 3rd actually). He's probably in the afterlife still trying to convince people that they would have won if he hadn't died.
35. Mike Pence (2016) Pence was a veteran of the House and was Governor of Indiana when he was selected by Donald Trump as a "normal" Republican who could appeal to evangelical voters. At the time he was in a tough re-election campaign that many thought he would lose (his opponent did not defeat Pence's replacement). He and Trump scored a shocking and improbable win in the election, taking the election despite losing the popular vote by quite a bit. He served four years in what is possibly the most controversial administration in American history and, at the end, captured the ire of Trump and his supporters by certifying the election of Joe Biden. During the events of January 6th he had to be hidden from the crowd where some expressed a desire to hang him. He ran for president in 2024 but withdrew from the race months before the first caucus.
34. Dan Quayle (1988, 1992) Picked as a youthful counterpart to George H.W. Bush, Quayle had served in the House and Senate for 11 years when he became the GOP nominee for VP. He was elected and served 4 years, during which his gaffes made him an occasional punchline and his opinions made him at times controversial. With Bush he ran for re-election in 1992 and lost. He considered running for either Governor of Indiana or President in 1996, but declined both - in part due to phlebitis, but did make a run for President in 2000. Like his fellow Hoosier Pence, Quayle withdrew months before the first caucus. He never faced the voters again (declining to run for Governor of Arizona - to which he moved in 1996 - in 2002). He became an endorser and advisor and most famously advised Mike Pence that he could not intervene in the certification of electoral votes to help Trump take the presidency after not winning.
33. Adlai Stevenson I (1892, 1900) Stevenson had served a couple of terms in the House and had been Cleveland's hatchet man at the Post Office, firing Republicans and replacing them with Democrats, for which he was rewarded with a nomination to the DC Supreme Court (though Republicans blocked him). From that he was able to secure nomination as Cleveland's VP in 1892, replacing the disloyal Morton, and served four years in the office. He was a candidate for the presidential nomination in 1896, but received little support. In 1900, he was again the Democratic nominee for VP, this time with William Jennings Bryan, but this time he lost. He ran for Governor of Illinois in 1908 and narrowly lost and then retired from politics. Stevenson was the 3rd of 4 people to win the nomination for Vice-President with different running mates.
32. Charles W. Fairbanks (1904, 1916) Fairbanks, a reporter turned lawyer turned railroad manager turned politician, was Teddy Roosevelt's VP for four years, but the two didn't see eye-to-eye. Roosevelt was a progressive and Fairbanks a conservative and Fairbanks worked in opposition of TR's signature "Square Deal" program, so when Fairbanks sought the presidential nomination in 1908 he failed to get TR's endorsement or the nod. Fairbanks made another run for the Republican nomination for president in 1916 and again failed, but was named the party's VP nominee - making him the last person to be on the bottom of the ticket with two different running mates. He fell ill shortly after his ticket lost the election and died in 1918
31. George Dallas (1844) Dallas, an ambassador and former Pennsylvania Attorney General, spent four years as VP and had hoped to secure the Presidential nomination in 1848, but was done in by his support for lower tariffs and came in 6th. He later served as Minister to the UK under three presidents before retiring.
30. Levi P Morton (1888) Morton, who'd served in the House and as minister to France, served as Benjamin Harrison's VP for four years. The two were never close and when the vote on a bill called the Lodge Bill that would permit the use of federal force to ensure the voting rights of black males in the former Confederacy resulted in a tie, Morton broke with Harrison and refused to save the bill. As a result, he was dropped from the ticket in 1892 and Harrison and his new running mate went on to lose. Two years later he won a 2-year term as Governor of New York. He was dropped as nominee two years later because of his support of civil service reform. That same year he was a leading contender for the Republican presidential, but lost to McKinley and then was considered for his VP, but Morton's campaign manager declined. He then retired from politics, living a long life involved in various clubs.
29. William A. Wheeler (1876) Wheeler, a 10 year veteran of the House, was Haye's VP for four years. After that he returned to New York to retire. During his retirement, he was nominated for the Senate three times, each time coming up short, but it's unclear how much he sought those offices.
28. Charles Curtis (1928) After 35 years in the House and Senate, Curtis was named as Hoover's running mate after losing the nomination to him. He had a quiet Vice-Presidency, was renominated with Hoover in 1932, though not easily, and lost. He then stayed in DC and worked as a lawyer until his sudden death just under 3 years later.
27. Henry A. Wallace (1940) Wallace's father had been Secretary of Agriculture and like him he became a champion of the little man. He too was appointed to lead Agriculture, for FDR and when Garner no longer became tenable as a choice to be FDR's running mate, FDR insisted that it be Wallace. Wallace saw the job as a demotion, but nonetheless wanted to remain FDR's running mate in 1944. But he was too strongly against segregation and too sympathetic to the Soviets and communists in general for most, so he was dropped. In thanks for his loyalty, FDR gave him a choice of any cabinet position except State and Wallace chose Secretary of Commerce to help rebuild the post-war economy. But when he gave a speech in contrast with the Truman doctrine, Truman forced him to resign. He ran a 3rd Party campaign as the Progressive Party's nominee in 1948, but left the part later for being too supportive of the Soviet Union. This was followed by a "long slow decline into obscurity marked by a certain acceptance of his outcast status." He's the last person to serve in a presidential cabinet after the Vice-Presidency.
26. Charles G. Dawes (1824) Dawes, a bureaucrat, businessman and WWI general, never won public office until he ran for Vice-President in 1924. He quickly fell out of favor with his President, Coolidge, and began skipping cabinet meetings. Even winning the Nobel Peace Prize in 1925 couldn't save him. He was considered as the VP nominee in 1928, but Coolidge killed that. After leaving office he served as Ambassador to the UK for more than two years and then headed the Reconstruction Finance Corporation (RFC). He was approached about running for VP in 1932 and for President in 1936, but declined both offers. He spent the last two decades of his life running his bank.
25. George Clinton (1788, 1792, 1804, 1808) Proving that the "third time's the charm" Clinton was the 1788 Anti-Federalist candidate and the 1792 Democratic-Republican nominee and lost both; but in 1804 and 1808 he was on the winning ticket - with two different presidents! (In 1796 he didn't run, but still came in 7th). He died in office after serving more than 7 years, so there was no chance for a post-VP career. Clinton has some oddities in his record - like running for VP with 3 different people and receiving electoral votes in 5 elections.
24. Alban W. Barkley (1948) Barkley was Truman's 2nd Choice for VP (after William O. Douglas) on what was suspected to be a losing ticket. After an upset victory, Barkley served for 4 years as VP and when Truman declined to run in 1952 made a run at the White House. Deemed too old (at 74) he lost to eventual election loser Adlai Stevenson II. Two years later he made a spirited run for the Senate and won a key race to give the Democrats a one-seat majority. He only served for 15 months before dropping dead live on the radio and in front of a crowd (proving that he likely would not have made it through his term if elected president).
23. Daniel D. Tompkins (1816, 1820) Tompkins was James Monroe's running mate and served 2 terms as Vice President. He's the only person to serve two full terms as VP in the 19th Century. While serving as VP he ran for Governor of NY and lost. Health problems, heavy drinking and financial dispute with the federal government made him unsuitable to succeed Monroe and he formally stated he was not running in 1824. Despite being one of the youngest people ever elected VP (taking office when he was just 42 years old), he died only 4 months after leaving office - mostly because of health problems related to a fall from a horse and his alcoholism.
22. Dick Cheney (2000, 2004) Cheney, a 10-year veteran of the House who moved into House leadership before becoming Secretary of Defense for the elder Bush, was asked by George W. Bush to find a VP nominee in 2000 and decided it should be... Dick Cheney. He served 8 controversial years and never showed any interest in public office again, becoming an advisor, supporter and critic. He was the subject of unflattering movies and documentaries.
21. Thomas R. Marshall (1912, 1916) Marshall, a recovered alcoholic and long-time Democratic party organizer from the progressive side of the party had been serving as governor of Indiana when he was tapped to be Woodrow Wilson's VP. He served two full terms as Veep, the first since Daniel Tompkins (also an alcoholic) nearly 100 years earlier to do so. He put his name in for the nomination for president in 1920 but found little support outside of Indiana. He was named to a pair of government boards and died at the Willard Hotel during a trip to DC a little more than 5 years after leaving office.
20. Walter Mondale (1976, 1980) Mondale was a veteran of the Senate when Carter chose him as his running mate. He served for 4 years during which he created the role of "activist vice-president". He had an office in the White House and started the tradition of weekly lunches with POTUS and was the first VP to live in the VP mansion. He remained on the ticket in 1980, which lost, making him the first VP to lose re-election since Curtis in 1932. He then went on to win the party's nomination for President in 1984, making him the only VP to lose his re-election bid and then get his party's nomination. But he lost to Reagan in a landslide. During the Clinton Administration he became Ambassador to Japan for 3 years and the Special Envoy to Indonesia. When Democratic Senator Paul Wellstone died, Mondale was his emergency replacement in the 2002 race, which he unexpectedly lost. He then "retired" to the role of political advisory and sought-after endorser before his death at 93.
19. Hannibal Hamlin (1860) Hamlin served one term as VP and was dropped for Andrew Johnson as Lincoln tried to widen his base and prepare for reconstruction. It's hard not to view that, in light of Johnson's presidency, as a mistake. We'll never know. After his term was up, he served briefly as Collector of the Port of Boston, returned to the Senate for 12 years and served as the Minister to Spain for almost a year.
18. Hubert H. Humphrey (1968) Humphrey who had already had two failed runs for the Democratic nomination for president by 1964, actively campaigned for the job of VP - thinking it was his best path to the White House. He was Senate Majority Whip at the time, so the job probably gave him less power, but more prestige. He had a muted role in the Johnson administration, but lots of publicity. He made one more run for president in 1968, and he was right that being Veep improved his chances and despite skipping the primaries (there were only 14 at the time) won the nomination - though notably one of his top competitors, RFK, was assassinated during the campaign. His time as nominee started with a disastrous convention and ended with a disastrous (for him) election night. He ran for the Senate in 1970, won and served until his death, after winning re-election in 1976. He made a 4th run for the presidency in 1972, but got little traction in the primaries. Despite polling showing him as a frontrunner in 1976, he decided not to make a 5th try. He did run for Majority Leader in 1977, but he lost that as well. He was given the honorary title of Deputy President Pro Tem of the Senate and died in 1978.
17. Al Gore (1992, 1996) Gore was a legacy Senator who had served in the House and Senate for 16 years and run for president in 1988 when he was selected by Clinton. Though another young southerner, Gore had one thing many Democrats did not - he'd voted for the wildly popular Persian Gulf War. He and Clinton won and then won re-election four years later. In 2000 he secured the Democratic nomination for President and then lost, possibly due to ballot and voting errors instead of voter preference, the closest presidential election in US history despite getting more votes than his opponent. He considered, but dismissed, another run in 2004 and was frequently discussed as a candidate for president in the following years. He starred in an Oscar winning documentary on global warming and shared the Nobel Peace Prize for his work on the issue.
16. John C. Calhoun (1824, 1828) The 1824 election was a mess without a real nominee, but Calhoun won the race (as the "running mate" of both of the top two presidential candidates). In 1828 he won re-election running AGAINST the president he'd just served under. Proving his likability, he was not asked to be Andrew Jackson's running mate in 1832 and resigned months before his term ended and immediately entered the Senate where he held some sway until he resigned in 1843 to prepare for a run for President in 1844. Before that election, he was named Secretary of State by John Tyler. He did not get much traction for the Democratic nomination in 1844 and dropped out of the race, but was able to influence who the nominee was by making Texas' annexation as a slave state into an issue. He returned to the Senate in 1845 and died as a sitting Senator in 1850. He had the longest post-VP Senate career in US history.
15. Earl Warren (1948) Warren was the Republican candidate for VP in 1948 as the bottom half of the "Dewey Defeats Truman" ticket. He remained governor of California and four years later made a run at the GOP presidential nomination coming in 3rd. In Eisenhower's first year, Chief Justice Fred Vinson died and Warren was tapped as his replacement. He's the only failed VP to serve on the Supreme Court. He was Chief Justice for 16 years and died five years after retiring.
14. Chester A. Arthur (1880) Arthur, a man plucked somewhat out of obscurity, served as Garfield's VP for about 6 months before he ascended to the White House following Garfield's assassination. Like the other ascendant VPs before him Arthur sought the party's nomination for president at the next convention, and like them, he failed. In poor health when he left office, he died the next year.
13. Andrew Johnson (1864) Johnson had only been VP for six weeks when he ascended to the Presidency (just 11 days shorter than Tyler). His presidency was contentious, since the Republicans who had nominated him disagreed with him and his policies. He was the first President to be impeached and dodged conviction by a hair. He sought the Democratic nomination for President in 1868, but was denied. He was seen as so beneath the post, that Grant refused to share a carriage with him on the way to the inauguration, as was customary. He ran for the Senate in 1870 and lost. He ran for the House in 1871 and lost again. He received some redemption when he was returned to the Senate in 1874. He only served a few months, during which Congress was only in session 19 days, before his death from a pair of strokes.
12. Millard Fillmore (1848) Fillmore, a veteran of the House, was Comptroller of NY when he was tapped to be the Whig nominee for VP. Two years later, he was President. 16 months after taking office as VP, Zachary Taylor died from diarrhea and Fillmore ascended to the Presidency. He sought the Whig nomination for president in 1852, losing narrowly to Winfield Scott. Adding injury to insult, his wife caught pneumonia at Franklin Pierce's inauguration and died a few weeks later. He won the nomination of the American (Know-Nothing) Party for President in 1856 and ran as a moderate, but was only able to win Maryland.
11. John Tyler (1836) In 1836, the newly-formed Whig Party was not organized enough to have a convention and settle on one ticket. Instead they ran at least five tickets with Tyler as VP on three of them. Nonetheless he only "won" three states. No candidate for VP won a majority that year and the VP had to be decided in a contingent election, but Tyler only finished 3rd and thus missed it. But in 1840, Tyler came back to fill in the bottom half of the "Tippecanoe and Tyler too" ticket that was swept into office, making Tyler the 2nd person to win the Vice-Presidency on his 2nd Try and the first since the Twelfth Amendment. His running mate Harrison was much older. Shortly after taking office he died of illness (though not from a cold caught during his inauguration as is so often stated) and Tyler became President. Tyler sought the White House again in 1840, but was not popular enough in the Whig Party so he created his own party - the Democratic-Republican Party which did nominate him. But it was loosely formed and he had no running mate. Late in the campaign, he dropped out and endorsed Polk, as long as Polk promised to annex Texas. After leaving office he returned to public life as sponsor and chairman of the Virginia Peace Convention in Washington, DC that was called in an effort to avoid the Civil War. When War broke out anyway. Tyler served on the convention between the Commonwealth of Virginia and the Confederate States of America that allowed Virginia to join, signed the Ordinance of Secession and was chosen as a delegate to the Provisional Confederate Conference, serving for five months before his death in 1862. He was also elected to the Confederate House of Representatives, but died a few weeks before it's first session.
10. Martin Van Buren (1832) - By the time he was tapped to replace Calhoun as Andrew Jackson's running mate, Van Buren had already been NY Attorney General, a Senator, Governor, Secretary of State of an ambassador. Not too shabby. Afterwards, he served four years as Vice-President and then pulled off what is a surprisingly difficult feat of winning the nomination for Presidency as VP and then the White House (John Adams, Thomas Jefferson and George H.W. Bush are the only others to do that). He served four years, won nominated again (also rare at the time) but lost in 1840. He sought the nomination in 1844, but lost due to his opposition of the annexation of Texas - in his post-presidency years he became more opposed to slavery. In 1848, he was nominated for President by the Free Soil Party - a group of anti-slavery Democrats - and ran one of the most successful 3rd party campaigns in US history. In his retirement he did not join his Free Soilers in the Republican Party, but stayed a Democrat to the end.
9. John Adams (1789, 1792) - Technically Adams ran for President in 1789 and 1792 and came in second, but really he was running for Vice-President since both "parties" (they weren't quite parties then like they are now) nominated Washington. Adams won the Vice-Presidency twice and then the Presidency in 1796, but lost re-election in 1800. After his presidency, he returned to Massachusetts and had a long, mostly quiet retirement, but lived long enough to see his son John Quincy Adams elected president.
8. Richard Nixon (1952, 1956) - The only person so far to pull off the double-double (winning two terms as VP and two as President - though he didn't finish the final term.) Nixon was chosen to be Ike's running mate in a "smoke-filled room" because of his youth, anti-communist reputation and his connection to California. He served two terms and with Ike created the role of the modern VP, with more responsibility than previous veeps. He even served as de facto acting President following Ike's heart attack. But he also had some controversy and nearly was left off the ticket in 1956. In 1960, he secured the Republican nomination for President, the first sitting VP to do that since Breckinridge 100 years earlier. He lost a close race and two years later lost a not close race for Governor of California. He then pulled off one of the most improbable come backs in US political history by winning the nomination and presidency in 1968. He was the first losing nominee to come back to win the White House since Grover Cleveland (a feat Trump is trying to repeat). He was re-elected in 1972 and then resigned in scandal. He spent the last 20 years of his life trying to rehabilitate his reputation and be seen as an elder statesman.
7. George H. W. Bush (1980, 1982) Bush had an unusual path to the VP nomination, he had served a few years in Congress in then in some 2nd tier political appointments in the Nixon and Ford administration, including less than a year as director of the CIA; but his surprise victory in the Iowa Caucus (in the newly emerging primary/caucus system for choosing nominees) and 2nd place finish in the nomination campaign gave him national credibility leading Reagan to chose him to appeal to moderates. He served two terms as Vice-President and then was elected president in his own right ("Reagan's 3rd term"). He was nominated for President again in 1992, but lost to Bill Clinton. Like Adams, he settled into a long, quiet retirement and lived to see his son elected President (and re-elected) The election of his son George W. Bush, only 8 years after leaving office, was seen at the time - at least in part - as the result of nostalgia for the elder Bush.
6. Joe Biden (2008, 2012) Biden had a long career in the Senate, and two failed runs for President, when he was selected by Obama to be his running mate in 2008. The two had developed a mutual respect during the 2008 campaign and Biden brought foreign policy/national defense experience and an appeal to working class whites that Obama lacked. They won re-election in 2012. In 2016 Biden was considered running, but ultimately declined for personal reasons and but also due to discouragement from those around him. But he ran for president in 2020 and won. He ran again in 2024, winning the most delegates and seemingly the nomination, but chose to withdraw after a disappointing June debate performance that heightened fears about that his age and health were damaging his electability and bringing the party down with it. Dropping out seemed to do much for his legacy, but it will still rely a lot on how the 2024 election goes.
5. Calvin Coolidge (1920) - Coolidge who, as governor of Massachusetts, rose to prominence after crushing a police strike, wasn't supposed to be the nominee in 1920. The party bosses chose Sen Irvine Lenroot of Wisconsin and then left the convention. But a whisper campaign started and Coolidge got the nomination when it was voted on. When Harding died, Coolidge ascended to the presidency. He was a popular president and easily won the 1924 election - despite a 3rd party opponent from his own side. He chose not to run for re-election in 1928 even though he was likely to win if he had (Hoover was elected instead as a way of continuing the administration). Had he served another term and lived the same amount anyway, he would've died with two months left in office, creating one of the shortest presidencies ever.
4. Lyndon B. Johnson (1960) Johnson, the last president to serve without a VP for any significant time, was a Senator from Texas when he was tapped as Kennedy's VP. He served for nearly three years before JFK was assassinated, during which time he tried to increase the power of the office - first by turning the "president of the Senate" job into something more like majority leader and, when that failed, by getting more responsibility in the executive branch. He ran for the office outright in 1964 and like Roosevelt and Truman won another term in his own right. He could've sought another term in 1968, but failing health and bad polling led him to announce that he would not. He had a relatively quiet post-presidency and was only lightly involved in the 1972 campaign.
3. Harry S. Truman (1944) Truman is perhaps the only person to come to office with people expecting him to ascend to the presidency. It's part of why Wallace was dropped and he was chosen. And as expected, his vice-presidency only lasted a season. His presidency, which included overseeing the victory in WWII, the creation of the post-war world and incremental Civil Rights improvements is consistently ranked among the top 10, making him the 2nd best ascendant president behind only TR. He won his own term in 1948 (a famous upset), but - though he considered it - was talked out of running for a 3rd term in 1952. He had a long, active retirement, but stayed out of official office during that time.
2.
Teddy Roosevelt (1900) - Roosevelt was Governor of New York when he was tapped to be VP and many thought he should have run for the top of the ticket that year, but he didn't want to challenge McKinley. He was offered the bottom of the ticket, instead of the job he really wanted, which was Secretary of War and when elected he found the job a bit boring. He started planning a run for 2004 and looked into going to law school. Then McKinley was assassinated and Roosevelt ascended to the presidency. Then he became the first ascendant
President to win another term. He probably could have won again in 1908, but wanted to honor his 1904 pledge not to and instead his hand-picked successor Taft won. After going on expedition for the Smithsonian he returned to the States and tried, unsuccessfully, to win the Republican nomination in 1912. Feeling cheated - though he lost fair and square - he created his own party and ran as 3rd party candidate, coming in 2nd in both Electors and votes - making him arguably the greatest 3rd party candidate of all time. He went on another expedition, campaigned for the Progressives and in 1916 again tried to win the nomination of the Republican Party and again failed. This time he turned down the Progressives nomination. He remained active in politics as a critic of Woodrow Wilson and a proponent of a League of Nations and turned down an invitation to run for Governor again.
The Greatest Of All Time
1. Franklin Delano Roosevelt (1920) FDR was by far the most successful failed VP ever, and there is hardly reason to believe he would be. At that point he'd won exactly one race, for the New York State Senate and served as Assistant Secretary of the Navy during World War I. A year after his loss he was stricken with polio. But in 1928 he was elected to the first of two terms as Governor of New York, a feat which on its own would place him around #7 on this list. Then, in 1932 he became the only failed VP to ever be elected President (Tyler ascended). And just to pile on, he did it 3 more times and is now ranked among the greatest American presidents. Of failed VPs, he is truly the GOAT.
*********
It's hard to imagine how someone could unseat Roosevelt. Even if someone did the unprecedented and served 6 years as VP and 10 as President, that might not be enough. It would probably take a combination of 2 terms as President and many years as Speaker, Majority Leader or Justice. Perhaps Pope or Secretary-General might suffice. Maybe 5 Super Bowl wins. Maybe.
Of the living veepstakes winners Biden and Harris are currently running for re-election is running for President and Biden is finishing up his term. Their status will depend heavily on the 2024 race. Kaine is still serving in the Senate. Palin and Pence have run for office within the last year and might run, or be tapped to serve, again in the future. Quayle, Ryan, Gore and Cheney seem to have left politics and public service. And Edwards may pull off a comeback at some point, but it seems unlikely.